Getting Going
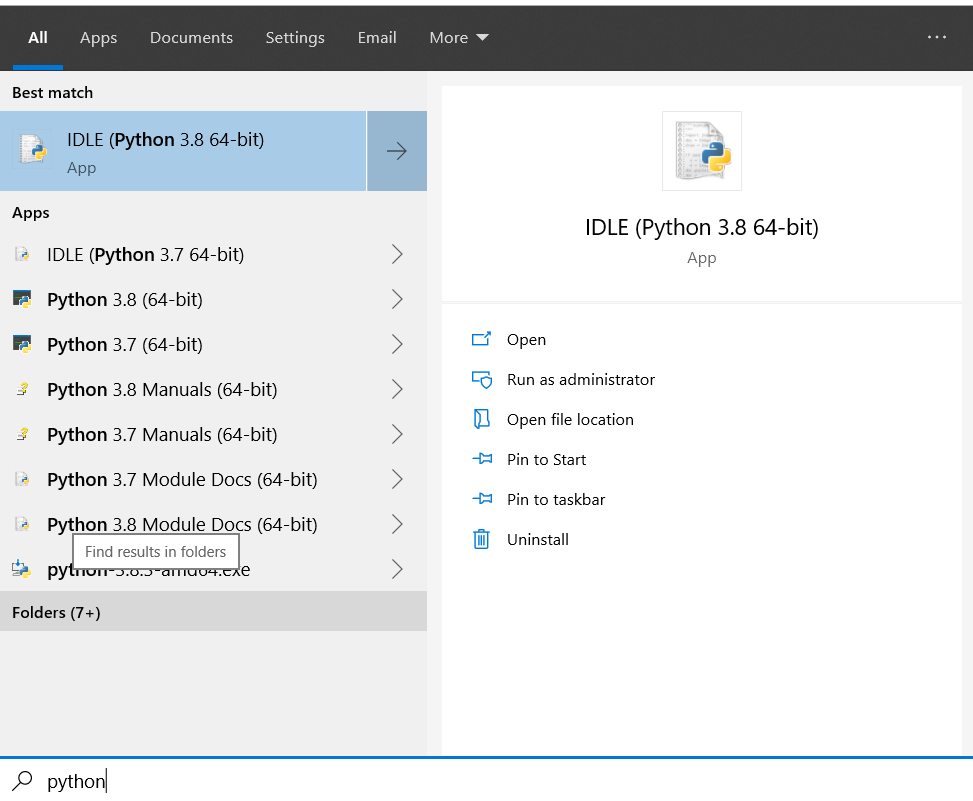
First things, open Python IDLE 3.8 (64-bit)…
and create a new file…
Save this file as Skin_Reflectance_Generation.py, or similar.

Skin_Reflectance_Generation.py
If you have a preferred IDE for authoring Python, feel free to use that. I wanted to keep this tutorial minimal, hence I’m using IDLE.
Chromophores and Power Curves
We now need to convert all those formulae on the previous chapter into Python code.
Let us begin by first creating a class and instancing that class. This is just the boiler-plate code to get us going:
class SkinAbsorption:
    def __init__(self):
        print("init SkinAbsorption")

skinAbsorption = SkinAbsorption()
class SkinAbsorption:
def __init__(self):
print("init SkinAbsorption")
Running this code should result in:

Now we need to generate the absorption coefficients. In order to go through each wavelength, we’ll need a for loop. We’ll put this into a new function, in our class like so:
class SkinAbsorption:

    def __init__(self):

        print("init SkinAbsorption")
def GetReflectanceValues(self):
wavelengths = range(380,790,10)
for nm in wavelengths:
print(f"{nm}")
skinAbsorption = SkinAbsorption()
skinAbsorption.GetReflectanceValues()We don’t need a value for every nm of light wavelength, 10nm intervals will suffice. We get enough precision without the overhead of hundreds of values. Running this code will output every wavelength we’re going to calculate values for.
In order to calculate values, we need to pass in values for our melanin fraction (Cm), hemoglobin fraction (Ch) and melanin blend (βm). Jimenez et al [2010] helpfully provide us with suitable ranges for us:
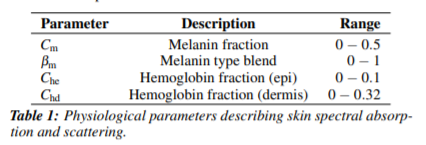
Its also worth noting that Jimenez et al [2010] also state we should sample cubicly to maximize texture space usage, so our sampling values should be:
Cm = [0.002, 0.0135, 0.0425, 0.1, 0.185, 0.32, 0.5]
Ch = [0.003, 0.02, 0.07, 0.16, 0.32]
Our blend value does not need to be cubic, we’ll do 3 samples to keep it fast and interpolate the values in our shader later.
βm = [0.01, 0.5, 0.99]
We’ll extract some more for loops in functions from these, like so:
class SkinAbsorption:
def __init__(self):
print("init SkinAbsorption")
def Generate(self):
groupByBlend = []
for Bm in [0.01,0.5,0.99]:
groupByMelanin = []
for Cm in [0.002,0.0135,0.0425,0.1,0.185,0.32,0.5]:
groupByHemoglobin = []
for Ch in [0.003,0.02,0.07,0.16,0.32]:
groupByHemoglobin.append(self.GetReflectanceValues( Cm, Ch, Bm ))
groupByMelanin.append(groupByHemoglobin)
groupByBlend.append(groupByMelanin)
return groupByBlend
def GetReflectanceValues(self, Cm, Ch, Bm):
ReflectanceValues = []
wavelengths = range(380,790,10)
for nm in wavelengths:
print(f"{nm} >> {Cm}, {Ch}, {Bm}")
return ReflectanceValues
skinAbsorption = SkinAbsorption()
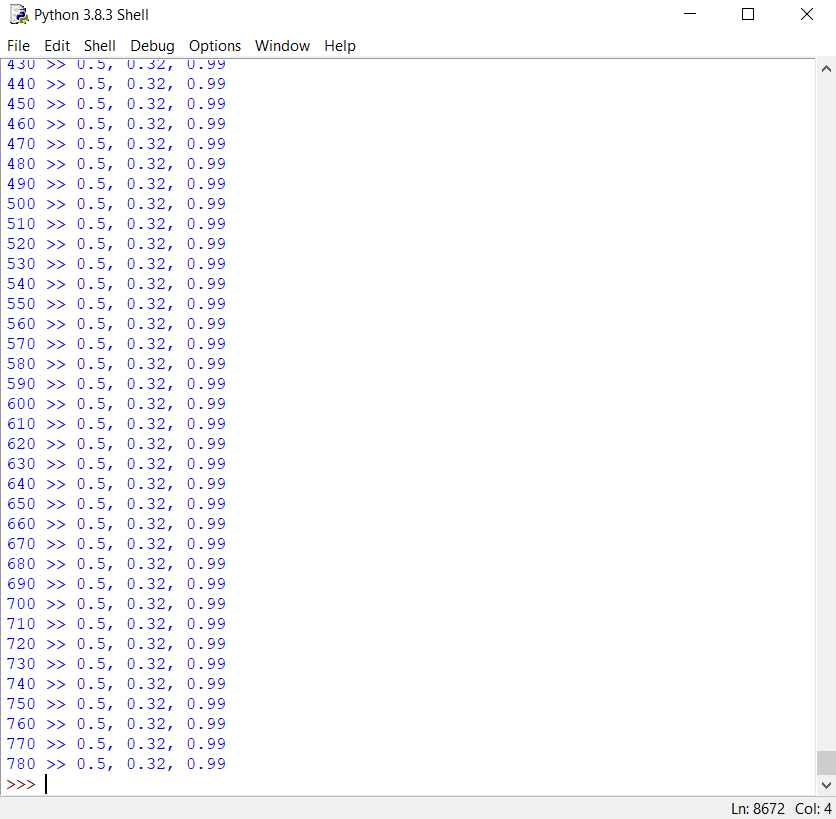
reflectanceValues = skinAbsorption.Generate()At the moment, running our code will just dump a list of wavelengths and our fractional and blend values, like so:
Now for the math!
We’ll replace our print line (on Line 21) with the following in order to generate our coefficients for epidermal absorption and scattering:
class SkinAbsorption:
    def __init__(self):
        print("init SkinAbsorption")

    def Generate(self):
        groupByBlend = []
        for Bm in [0.01,0.5,0.99]:
            groupByMelanin = []
            for Cm in [0.002,0.0135,0.0425,0.1,0.185,0.32,0.5]:
                groupByHemoglobin = []
                for Ch in [0.003,0.02,0.07,0.16,0.32]:
                    groupByHemoglobin.append(self.GetReflectanceValues( Cm, Ch, Bm ))
                groupByMelanin.append(groupByHemoglobin)
            groupByBlend.append(groupByMelanin)
        return groupByBlend

    def GetReflectanceValues(self, Cm, Ch, Bm):
        ReflectanceValues = []
        wavelengths = range(380,790,10)
        for nm in wavelengths:

            # First layer absorption - Epidermis
            SAV_eumelanin_L = 6.6 * pow(10,10) * pow(nm,-3.33)
            SAV_pheomelanin_L = 2.9 * pow(10,14) * pow(nm,-4.75)
            epidermal_hemoglobin_fraction = hemoglobin_fraction * 0.25

            # baseline - used in both layers
            baselineSkinAbsorption_L = 0.0244 + 8.54 * pow(10,-(nm-220)/123))

            # Epidermis Absorption Coefficient:
            epidermis = melanin_fraction * ((melanin_type_blend * SAV_eumelanin_L) +((1 -  melanin_type_blend ) * SAV_pheomelanin_L)) + ((1 - epidermal_hemoglobin_fraction) * baselineSkinAbsorption_L)

            # Scattering coefficients
            scattering_epidermis = pow(14.74 * nm, -0.22) + 2.2 * pow(10,11) * pow(nm, -4)
            scattering_dermis = scattering_epidermis * 0.5

            # Index of refraction - we assume a constant value of 1.4 as it changes very little through the skin

            print(f"{SAV_eumelanin_L}, {SAV_pheomelanin_L}, {baselineSkinAbsorption_L},  {epidermis}, {scattering_epidermis}, {scattering_dermis}")

        return ReflectanceValues

skinAbsorption = SkinAbsorption()
reflectanceValues = skinAbsorption.Generate()
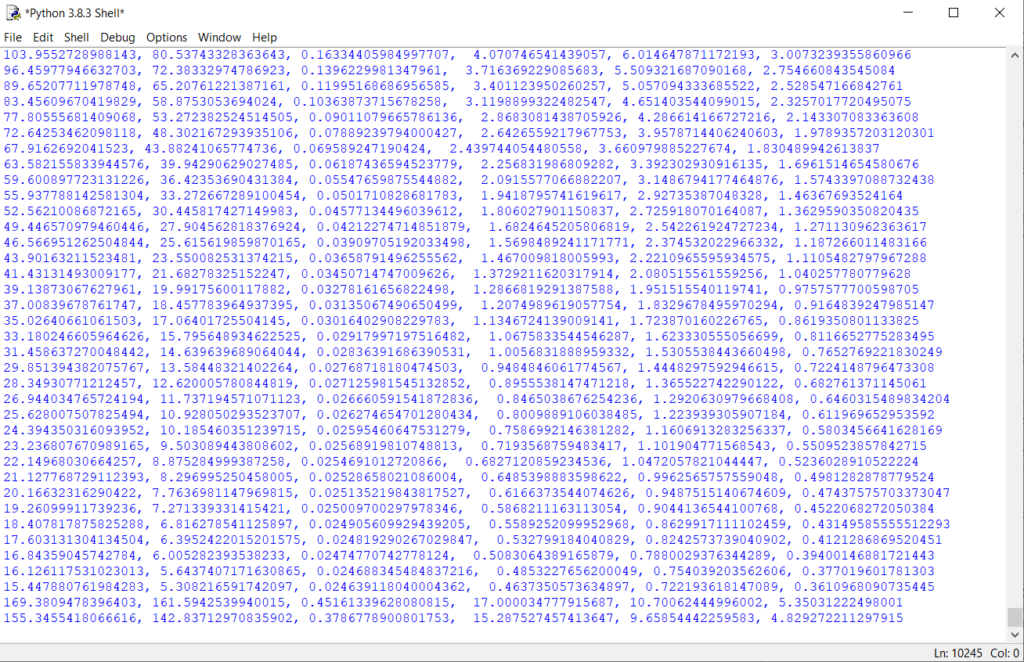
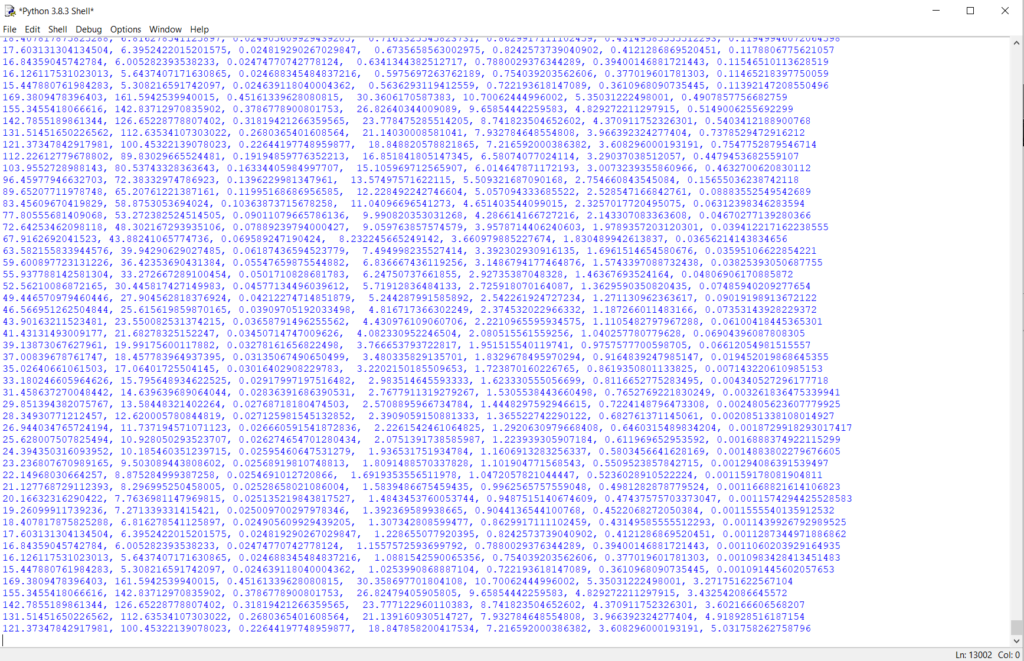
Running those code should produce a lot of values! We don’t have to make sense of these yet, we’ll debug these later.
Extracting Graph Data to CSV
The dermis is a bit more complicated as we can’t easily reconstruct the data. What we need to do is to get actual data that maps wavelengths to coefficients.
There is a file format, known as CSV, which stands for “comma separated values”. It is simply a list of rows and column values, with each column separated by a comma and each row in on a new line. Its structure looks identical to the values we just printed in the image above, i.e.:
columnName1,columnName2,columnName3
234,456,789
136,234,567
...
You can upload an image, define the graph boundaries and axis, and get out CSV values as a file. It is perfect for this sort of thing.
Let’s graph a graph that has the data we want to sample, and load it into graphreader:

Make the blue box surround the values from 300-800 (we can remove rows we don’t want after). Then start double clicking add to add points along one of the lines. Be sure to set the axis appropriately:
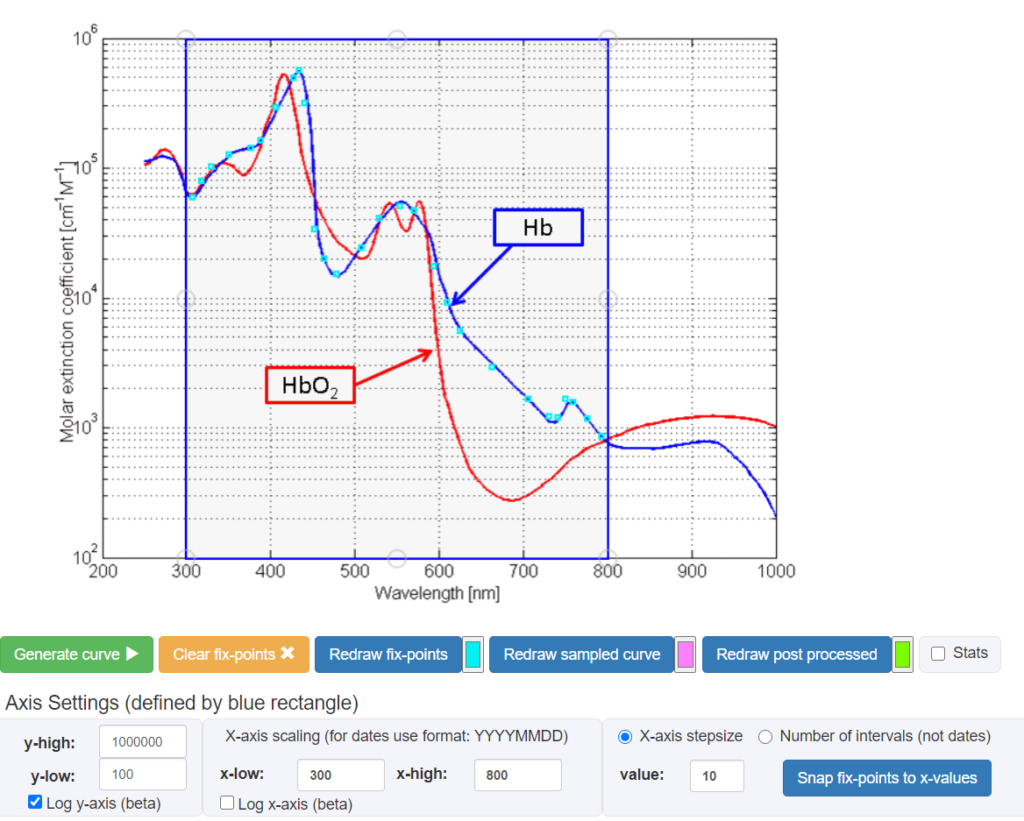
Then, “Redraw fix-points”, then “Generate curve”, you will get the following values output:
These values are measured in [cm-1M-1], so we need to divide these down by 100.
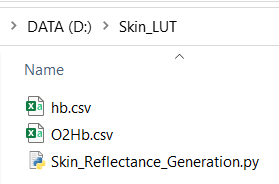
My CSV files for oxygenated and deoxygenated hemoglobin are here. Feel free to download them if you have issues with graph reader.
Save them into the same location as your python file as O2hb.csv and hb.csv respectively:
Now we can update our dermis absorption section, add this to our code between epidermis and the scattering calculation:
# Second layer absorption - Dermis
gammaOxy = self.O2Hb[int(nm)]
gammaDeoxy = self.Hb[int(nm)]
A = 0.75 * gammaOxy + (1 - 0.75) * gammaDeoxy
dermis = Ch * (A + (( 1 - Ch) * baselineSkinAbsorption_L))
This won’t work yet! We need to load our CSV data. Above the __init__ function add the following:
class SkinAbsorption:

    O2Hb = {}
    Hb = {}

    def __init__(self):
    #...
Then, in the __init__ function, do the following:
    HbFile = open('hb.csv', "r")
    O2HbFile = open('O2Hb.csv', "r")

    HbLines = HbFile.readlines()
    for line in HbLines:
        splitLine = line.split(",")
        self.Hb[int(splitLine[0])] = float(splitLine[1].rstrip("\n"))

    O2HbLines = O2HbFile.readlines()
    for line in O2HbLines:
        splitLine = line.split(",")
        self.O2Hb[int(splitLine[0])] = float(splitLine[1].rstrip("\n"))

    HbFile.close()
    O2HbFile.close()
This will open and read the CSV files and write them to a python dictionary, where each key-value pair is:
{ key : value} = { wavelength : absorption coefficient }
In other words:
{ 380 : 97.58 , 390 : 100.024, …}
Running it, you should get this sort of garbage in your console window!
Debugging Values to CSV
The final thing to do is to check all our values are as we expect. As you can see, we’re dumping a load of values to the console that look remarkably like CSV values already – this is no coincidence.
Instead of printing the values, we shall compress them into a string and write this out to a CSV ourselves, so we can create the debug graphs we want in Excel (or other Spreadsheet software).
First, lets remove the printing and convert it to an appended string. We’ll set the first line to be our column headings, and make sure we add the wavelength of light for easier reading later. Like so:
def Generate(self):
CSV_Out = "Wavelength,Eumelanin,Pheomelanin,Baseline,Epidermis,ScatteringEpi,ScatteringDerm,Dermis\n"
groupByBlend = []
for Bm in [0.01,0.5,0.99]:
groupByMelanin = []
for Cm in [0.002,0.0135,0.0425,0.1,0.185,0.32,0.5]:
groupByHemoglobin = []
for Ch in [0.003,0.02,0.07,0.16,0.32]:
values = self.GetReflectanceValues( Cm, Ch, Bm )
CSV_Out = CSV_Out + values
groupByHemoglobin.append(values)
groupByMelanin.append(groupByHemoglobin)
groupByBlend.append(groupByMelanin)
CSV_Out_File = open("AbsorptionValues.csv","w+")
CSV_Out_File.write(CSV_Out)
CSV_Out_File.close()
return groupByBlend
def GetReflectanceValues(self, Cm, Ch, Bm):
CSV_Out = ""
wavelengths = range(380,790,10)
for nm in wavelengths:
# First layer absorption - Epidermis
SAV_eumelanin_L = 6.6 * pow(10,10) * pow(nm,-3.33)
SAV_pheomelanin_L = 2.9 * pow(10,14) * pow(nm,-4.75)
epidermal_hemoglobin_fraction = Ch * 0.25
# baseline - used in both layers
baselineSkinAbsorption_L = 0.0244 + 8.54 * pow(10,-(nm-220)/123)
# Epidermis Absorption Coefficient:
epidermis = Cm * ((Bm * SAV_eumelanin_L) +((1 - Bm ) * SAV_pheomelanin_L)) + ((1 - epidermal_hemoglobin_fraction) * baselineSkinAbsorption_L)
# Second layer absorption - Dermis
gammaOxy = self.O2Hb[int(nm)]
gammaDeoxy = self.Hb[int(nm)]
A = 0.75 * gammaOxy + (1 - 0.75) * gammaDeoxy
dermis = Ch * (A + (( 1 - Ch) * baselineSkinAbsorption_L))
# Scattering coefficients
scattering_epidermis = pow(14.74 * nm, -0.22) + 2.2 * pow(10,11) * pow(nm, -4)
scattering_dermis = scattering_epidermis * 0.5
# Index of refraction - we assume a constant value of 1.4 as it changes very little through the skin
NR = 1.4
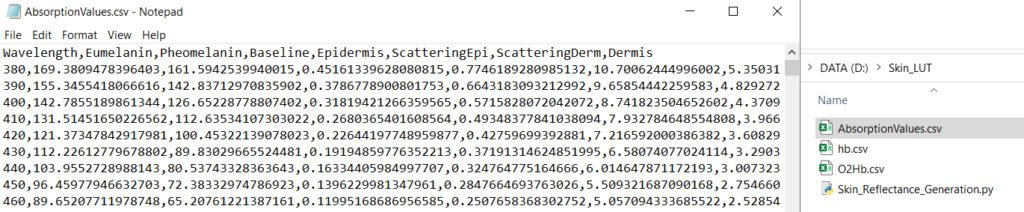
CSV_Out = CSV_Out + f"{nm},{SAV_eumelanin_L},{SAV_pheomelanin_L},{baselineSkinAbsorption_L},{epidermis},{scattering_epidermis},{scattering_dermis},{dermis}\n"
return CSV_OutThis will now output a CSV in our folder:
For completeness, here is the Python code so far:
class SkinAbsorption:

    O2Hb = {}
    Hb = {}

    def __init__(self):
        print("init SkinAbsorption")
        HbFile = open('hb.csv', "r")
        O2HbFile = open('O2Hb.csv', "r")

        HbLines = HbFile.readlines()
        for line in HbLines:
            splitLine = line.split(",")
            self.Hb[int(splitLine[0])] = float(splitLine[1].rstrip("\n"))

        O2HbLines = O2HbFile.readlines()
        for line in O2HbLines:
            splitLine = line.split(",")
            self.O2Hb[int(splitLine[0])] = float(splitLine[1].rstrip("\n"))

        HbFile.close()
        O2HbFile.close()

    def Generate(self):
        CSV_Out = "Wavelength,Eumelanin,Pheomelanin,Baseline,Epidermis,ScatteringEpi,ScatteringDerm,Dermis\n"
        groupByBlend = []
        for Bm in [0.01,0.5,0.99]:
            groupByMelanin = []
            for Cm in [0.002,0.0135,0.0425,0.1,0.185,0.32,0.5]:
                groupByHemoglobin = []
                for Ch in [0.003,0.02,0.07,0.16,0.32]:
                    values = self.GetReflectanceValues( Cm, Ch, Bm )
                    CSV_Out = CSV_Out + values
                    groupByHemoglobin.append(values)
                groupByMelanin.append(groupByHemoglobin)
            groupByBlend.append(groupByMelanin)
        CSV_Out_File = open("AbsorptionValues.csv","w+")
        CSV_Out_File.write(CSV_Out)
        CSV_Out_File.close()
        return groupByBlend

    def GetReflectanceValues(self, Cm, Ch, Bm):
        CSV_Out = ""
        wavelengths = range(380,790,10)
        for nm in wavelengths:

            # First layer absorption - Epidermis
            SAV_eumelanin_L = 6.6 * pow(10,10) * pow(nm,-3.33)
            SAV_pheomelanin_L = 2.9 * pow(10,14) * pow(nm,-4.75)
            epidermal_hemoglobin_fraction = Ch * 0.25

            # baseline - used in both layers
            baselineSkinAbsorption_L = 0.0244 + 8.54 * pow(10,-(nm-220)/123)

            # Epidermis Absorption Coefficient:
            epidermis = Cm * ((Bm * SAV_eumelanin_L) +((1 -  Bm ) * SAV_pheomelanin_L)) + ((1 - epidermal_hemoglobin_fraction) * baselineSkinAbsorption_L)

            # Second layer absorption - Dermis
            gammaOxy = self.O2Hb[int(nm)]
            gammaDeoxy = self.Hb[int(nm)]
            A = 0.75 * gammaOxy + (1 - 0.75) * gammaDeoxy
            dermis = Ch * (A + (( 1 - Ch) * baselineSkinAbsorption_L))

            # Scattering coefficients
            scattering_epidermis = pow(14.74 * nm, -0.22) + 2.2 * pow(10,11) * pow(nm, -4)
            scattering_dermis = scattering_epidermis * 0.5

            # Index of refraction - we assume a constant value of 1.4 as it changes very little through the skin
            NR = 1.4
            CSV_Out = CSV_Out + f"{nm},{SAV_eumelanin_L},{SAV_pheomelanin_L},{baselineSkinAbsorption_L},{epidermis},{scattering_epidermis},{scattering_dermis},{dermis}\n"
        return CSV_Out

skinAbsorption = SkinAbsorption()
reflectanceValues = skinAbsorption.Generate()
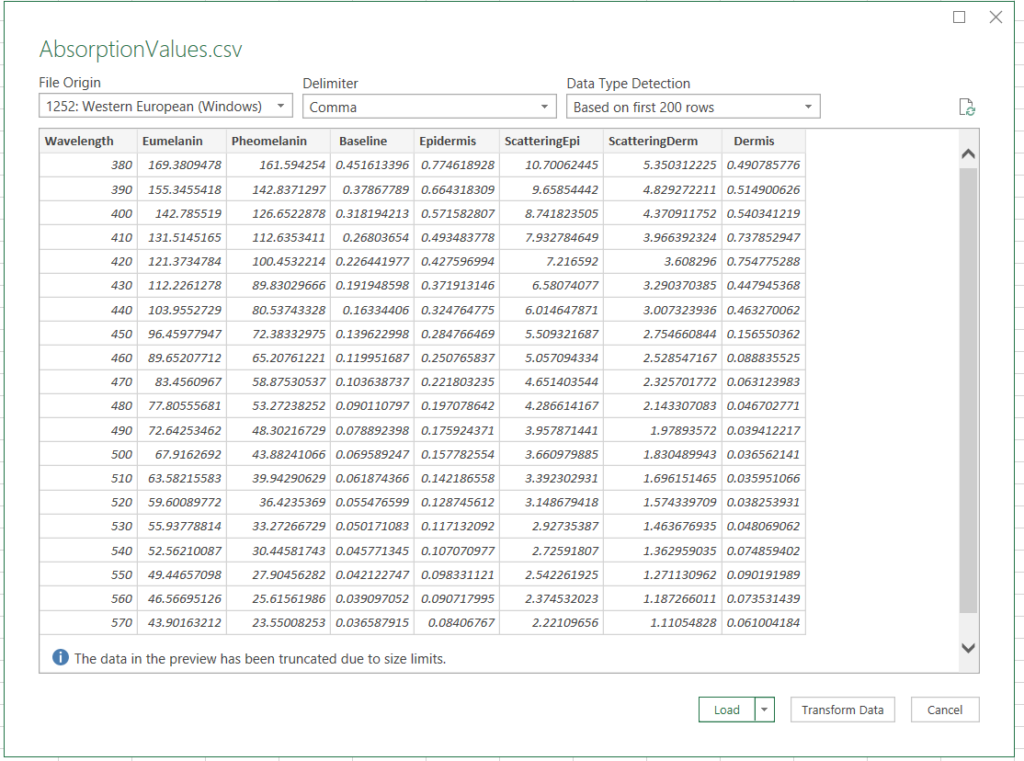
Now we just need to bring this into a program that can graph. For this, we’ll use Excel. Open it up, and click the “Data” tab, then “Import from Text/CSV”

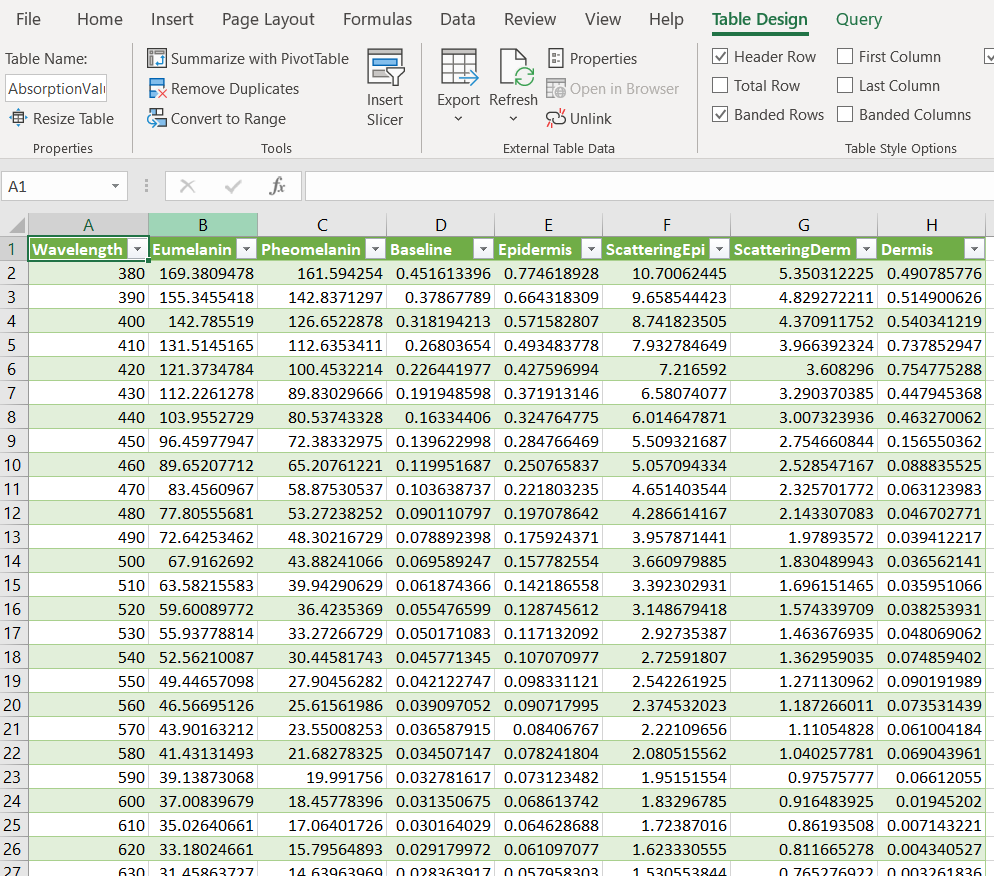
Find our CSV and bring the data in
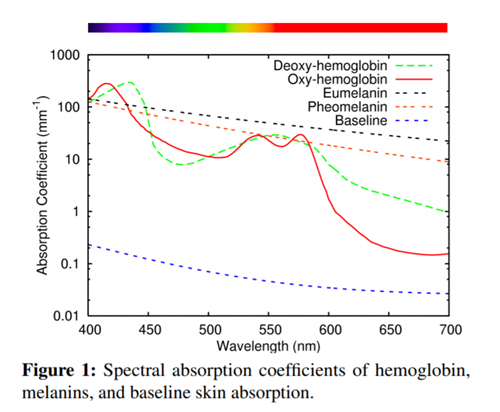
Firstly this is the graph we want to check our absorption coefficient values against (you may recognize it…):
We’ll grab these columns and plot them:
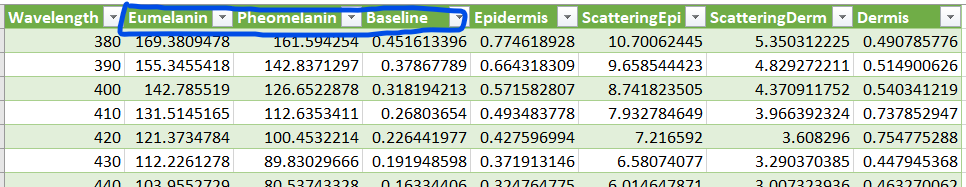
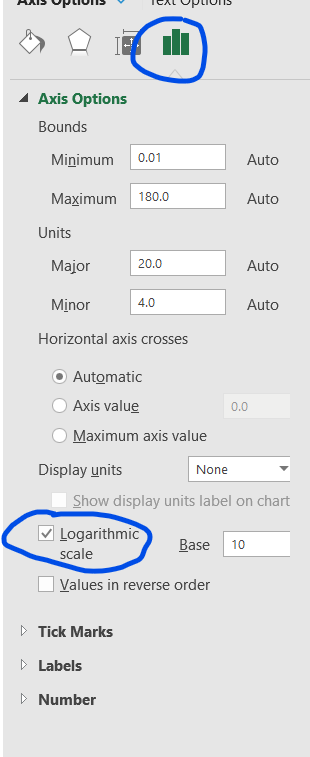
Select the three columns, plot to a line chart. You can adjust the x-axis names if you want, as have I. You’ll want to edit the Y-Axis to be logarthmic, like so:

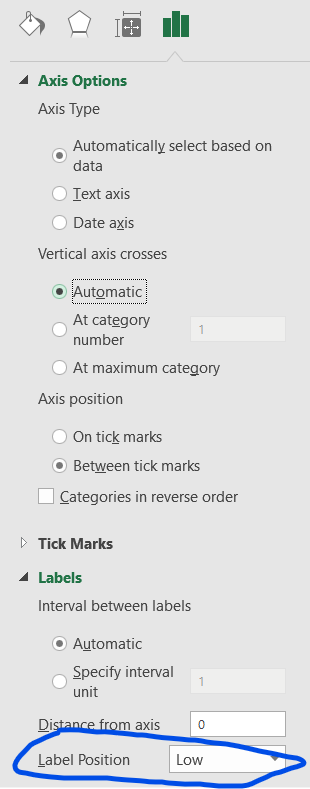
Finally, format the X-axis and set it to be:
You should now have a chart that looks like so:
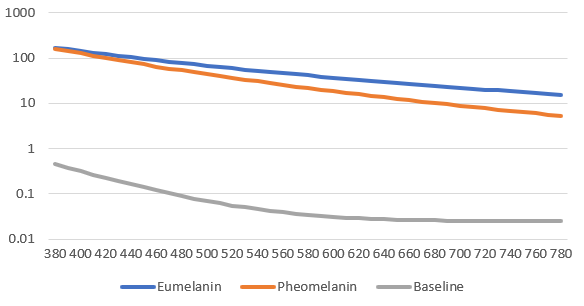
Great! So your absorption coefficients for melanin and the baseline are correct! It becomes trickier to do the epidermis and dermis values because these vary based on all the fractional and blend values – but the graph setup remains the same if you wish to debug values.
In the next chapter we’re going to learn how to start simulating photons through these mediums we’ve now defined, using the Monte Carlo method. Buckle in!